if (!require("BiocManager", quietly = TRUE))
    install.packages("BiocManager")

BiocManager::install("ggmsa")
install.packages("ggaligner")
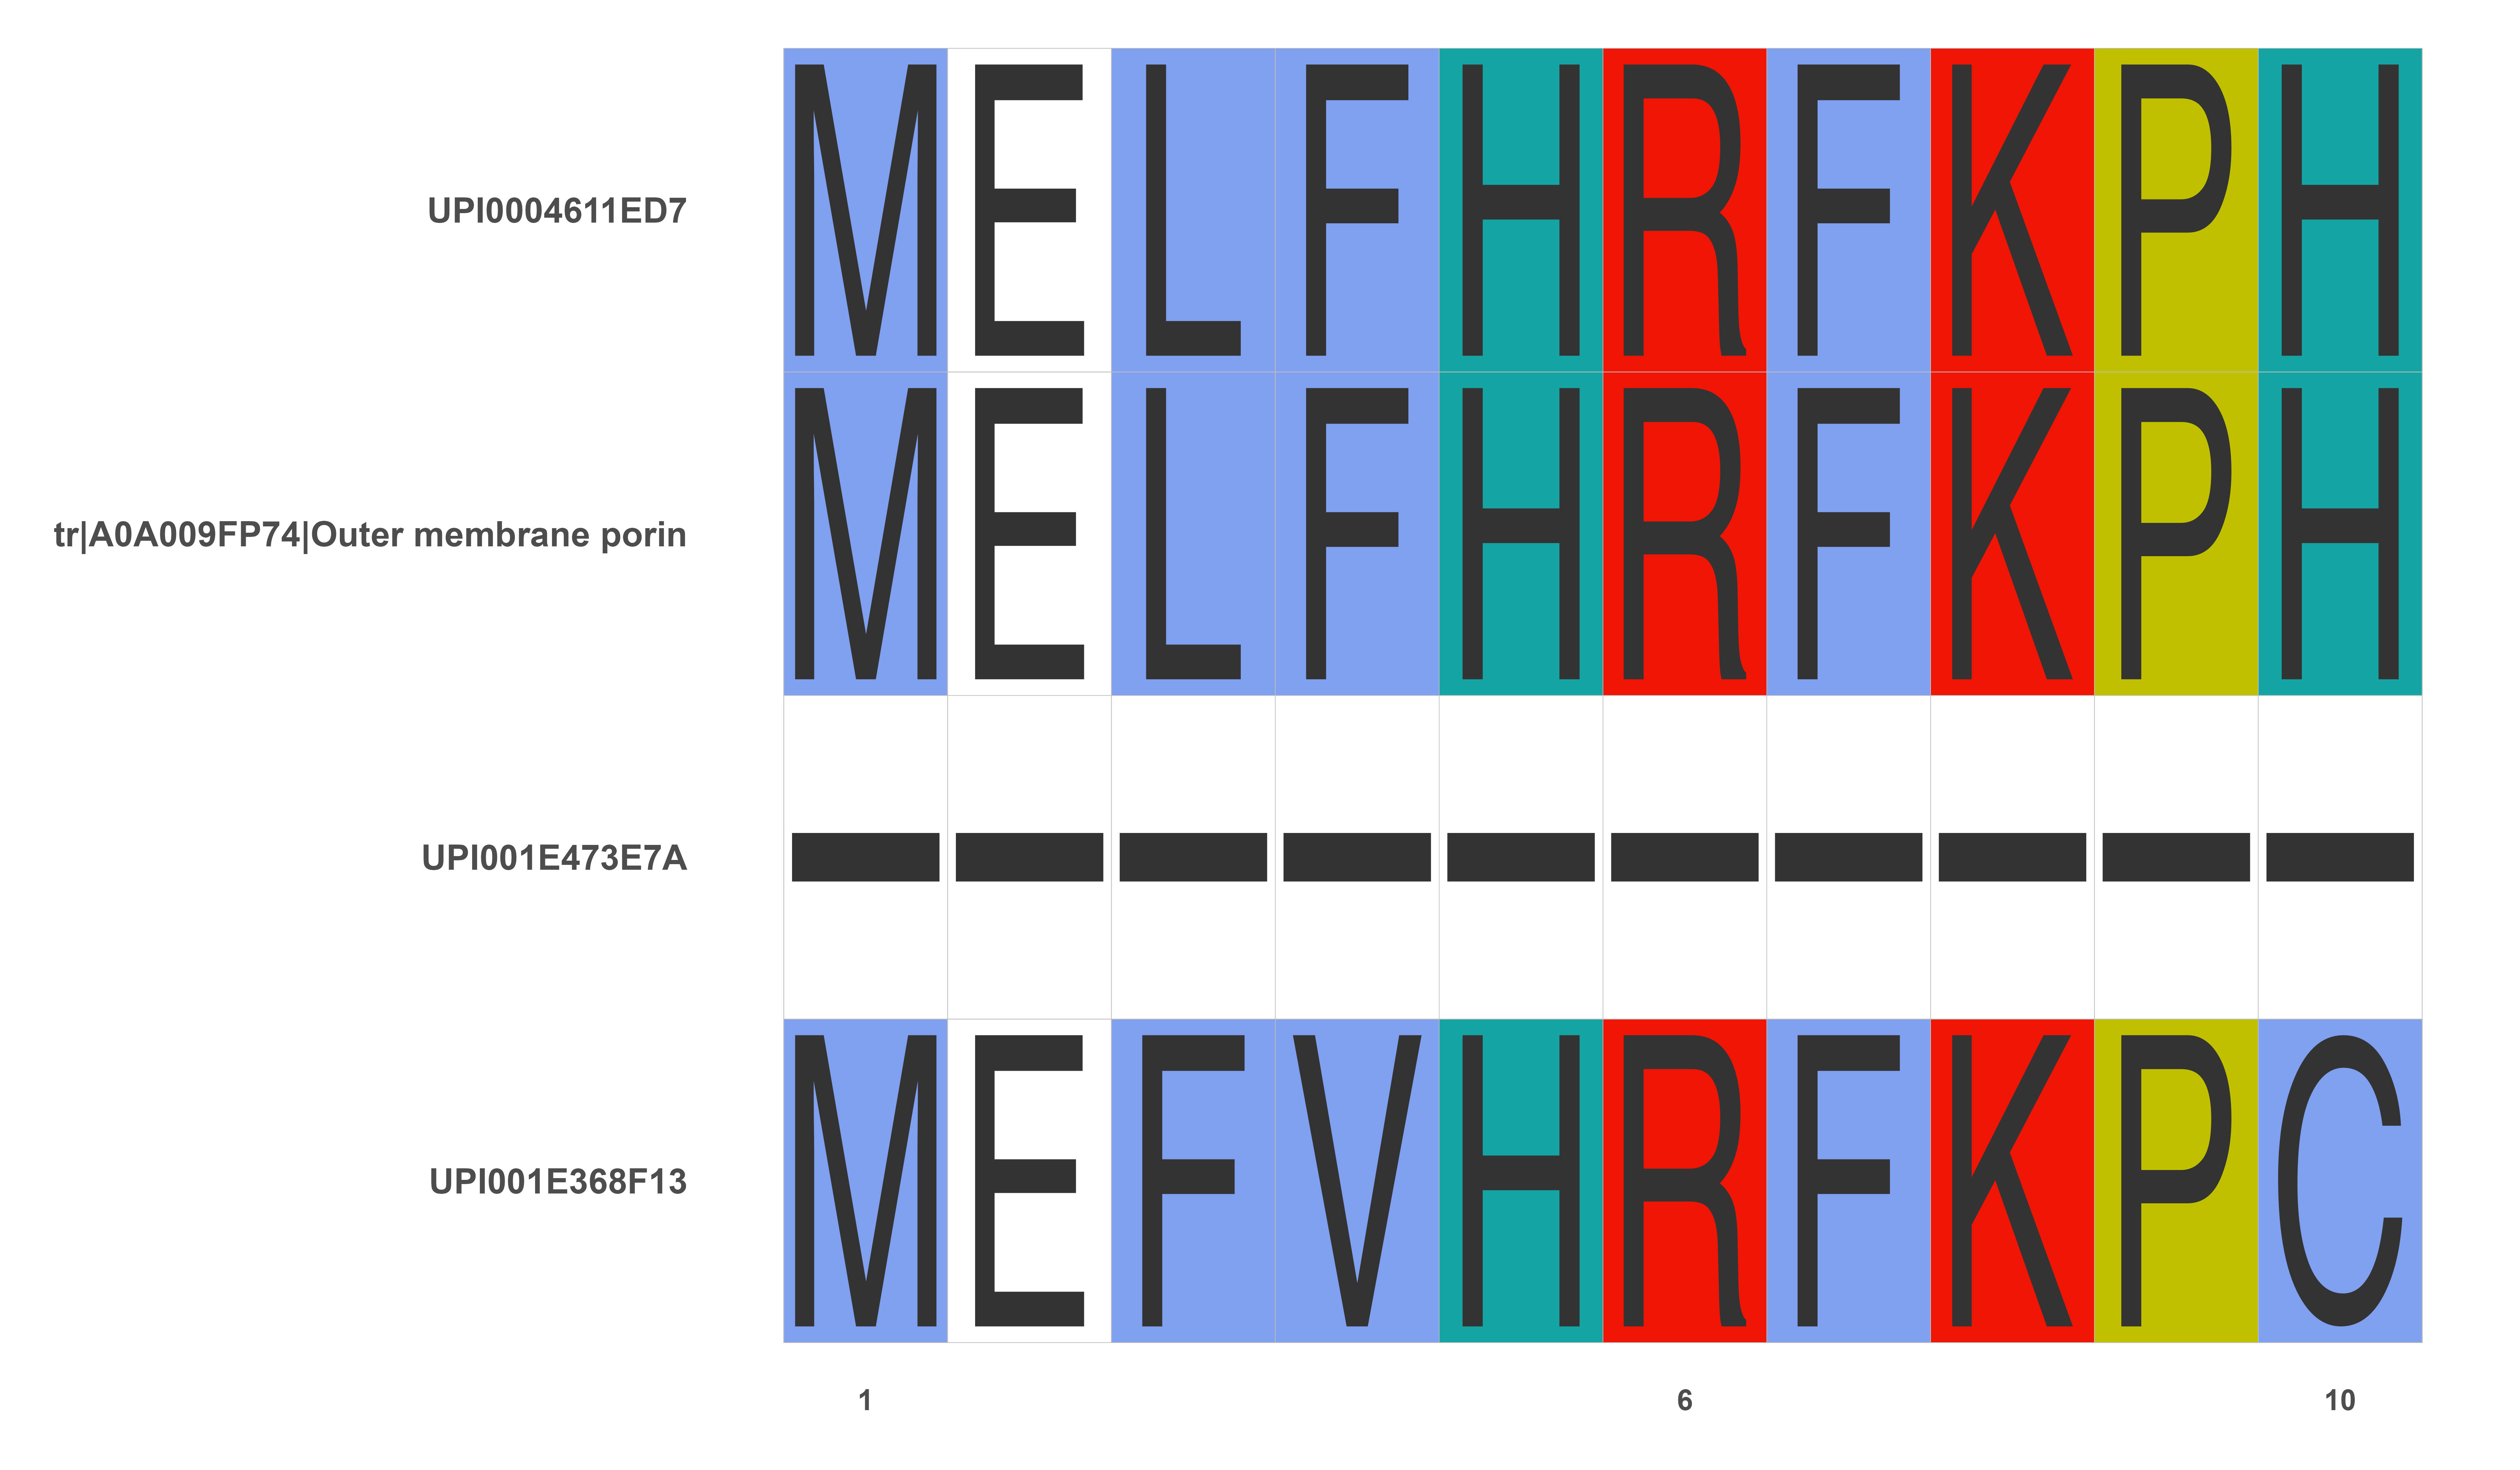
Providing publication-ready graphs for Multiple sequence alignment. Moreover, it provides a unique solution for visualizing the multiple sequence alignment without the need to do the alignment in each run which is a big limitation in other available packages.
The package is mainly designed for researchers to facilitate generating publication-ready graphs for multiple sequence alignment of regions of interests in DNA or Protein sequences
For the documentation see: ggaligner Documentation.
Example
library(Biostrings)
library(ggaligner)
library(msa)
#Read FASTA file
fasta_sample <- readAAStringSet("sample_data/test_sample.fasta")
#Perform Multiple sequence alignment
aln_sample <- msa(fasta_sample)
#Visualize the alignment using ggaligner with default parameter
ggaligner(aln_sample)
#Change the visualization style
P <- ggaligner(aln_sample, start = 100, end = 125, color = "Shapely_AA", font = "TimesNewRoman")
#Save the alignment image to be used for publication
ggsave(filename = "test_sample.jpeg",plot = P, width = 12, height = 7, dpi = 600)
For bugs and suggestions, the most effective way is by raising an issue on the GitHub issue tracker. GitHub allows you to classify your issues so that we know if it is a bug report, feature request, or feedback to the authors.
Email: MohmedSoudy2009@gmail.com